Sensor spotlight: Decentlab's new DL-RAD

Whether in open water, in a tank, or in retention basins — knowing the water level continuously and remotely is critical for operations and resource management.

Not every measuring point can be reached from below. A pump station, a stormwater overflow basin, a stream under a bridge — these are measured from above, without touching the medium.

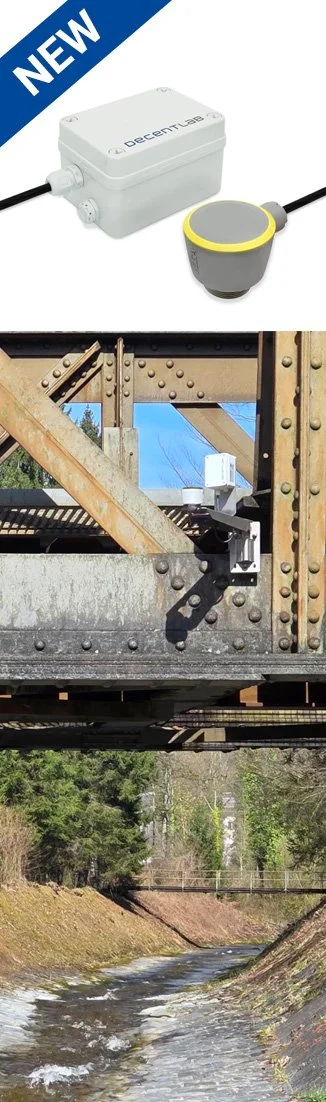
That is what the DL-RAD | Radar Distance / Level Sensor for LoRaWAN® is built for. It measures distance and level using 80 GHz radar technology, with a beam angle of 8° and a resolution of 1 mm. Beyond level monitoring, it suits water treatment, bulk solids in silos. It is a generic and very robust ranging and proximity monitoring device.

Device and sensor head are connected by a 5 m cable. Power comes from two C alkaline batteries, data transmission runs over LoRaWAN®.

What sets it apart:

  • Measures from above: contactless 80 GHz radar — nothing is submerged, nothing touches the medium.
     

  • Focused beam: an 8° beam angle keeps the measurement on a narrow spot instead of spreading across the surroundings.
     

  • Resolves small changes: 1 mm resolution with a deviation of ≤ 2 mm, across a range of 0 … 20 m.
     

  • Long battery life: unattended operation on two C alkaline batteries, ideal for remote measurement sites.

Applications: Level monitoring · Water level monitoring · Flood monitoring · Pump stations and stormwater overflow basins · Water treatment · Bulk solids in silos · Generic ranging and proximity monitoring
→ More about DL-RAD

Karlsruhe is watering by the numbers — with 100 Decentlab DL-SMTP sensors

Hotter summers and longer dry periods are making needs-based watering more important, and young trees feel it first — their root systems are still developing, which is what makes them so sensitive to drought.

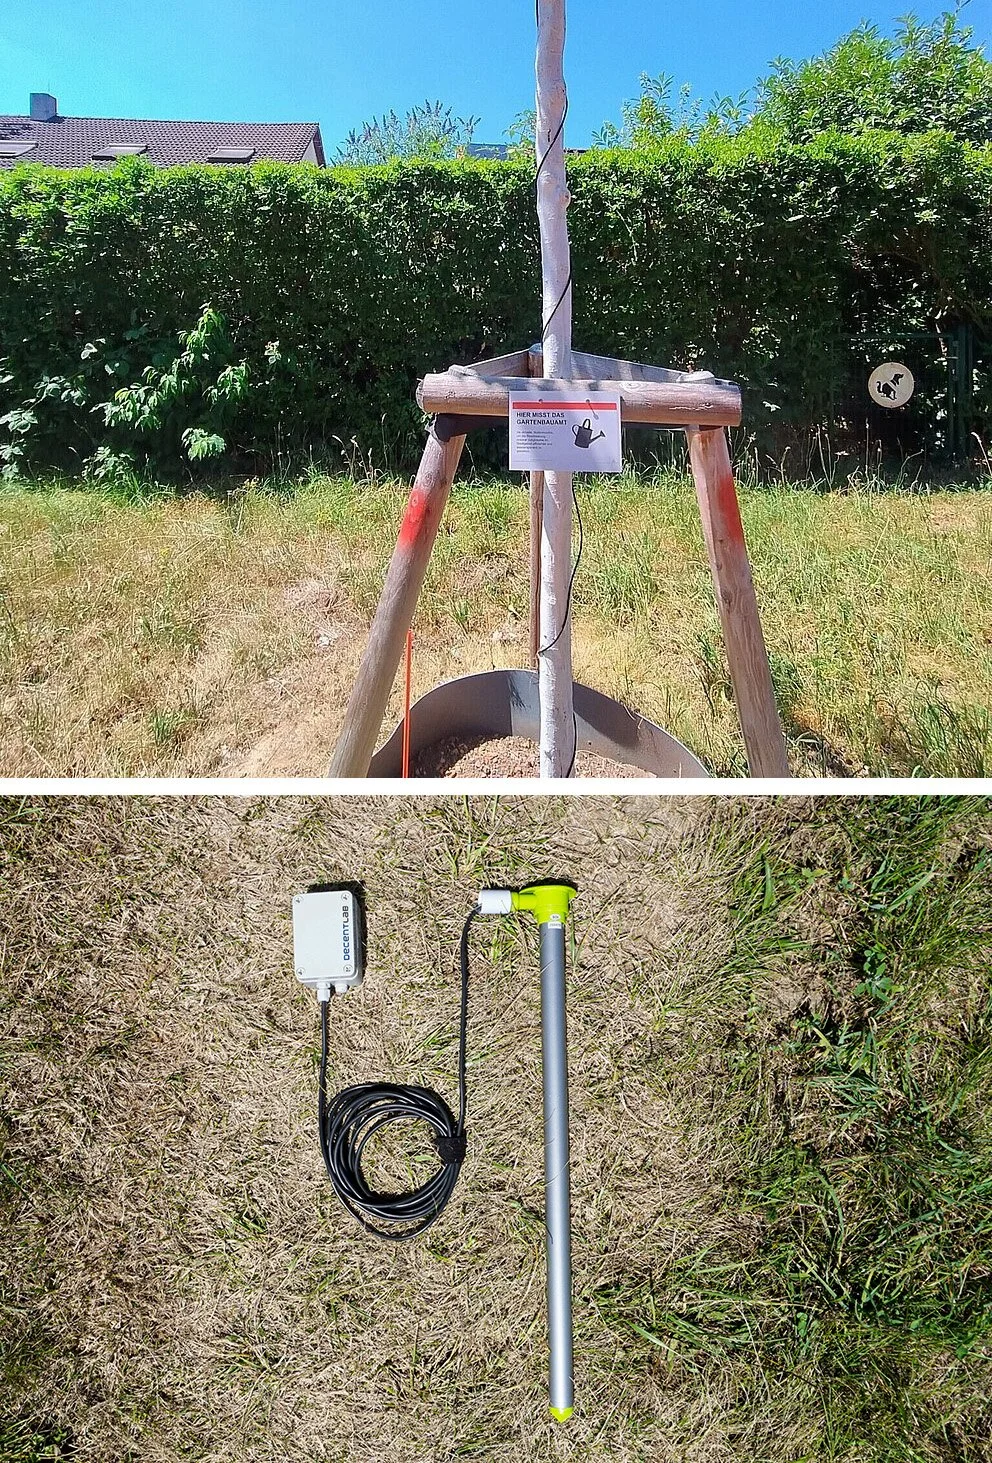
Since July 2026, Karlsruhe's parks department has been running a trial on 100 young trees, the first step toward a city-wide network. The sensors sit in the root zone and measure continuously.

In the ground are 100 Decentlab sensors: the DL-SMTP | Soil Moisture and Temperature Profile for LoRaWAN®. Each measures moisture and temperature at six depths across a 600 mm profile. Six readings per tree instead of one, spread through the soil layers.

That distinction is doing the work here. According to the department, early results point to a pattern: watering tends to reach the upper soil layers, which dry out quickly in high temperatures. The deeper layers often receive too little — and those are exactly where a young tree's roots are meant to grow over time.

The data should show which trees actually need water, where watering is most urgent, and how long water stays available in each layer.

None of it replaces the watering can: the city still asks residents to help water during dry periods.

The soil looks watered. The profile shows where the water stopped.

More about the project

What our DL-SHT35 has seen in a cold air pool

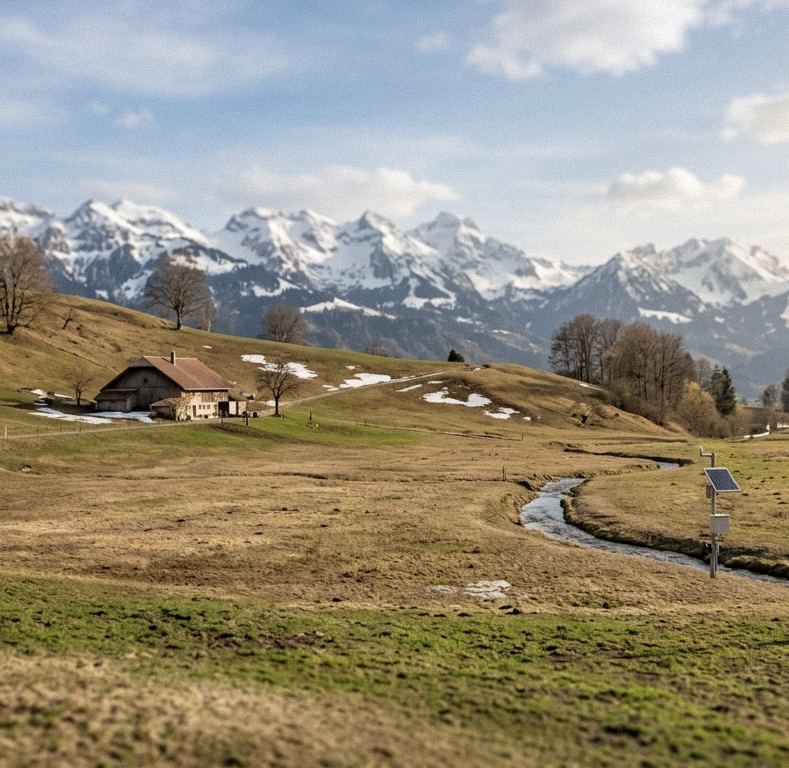
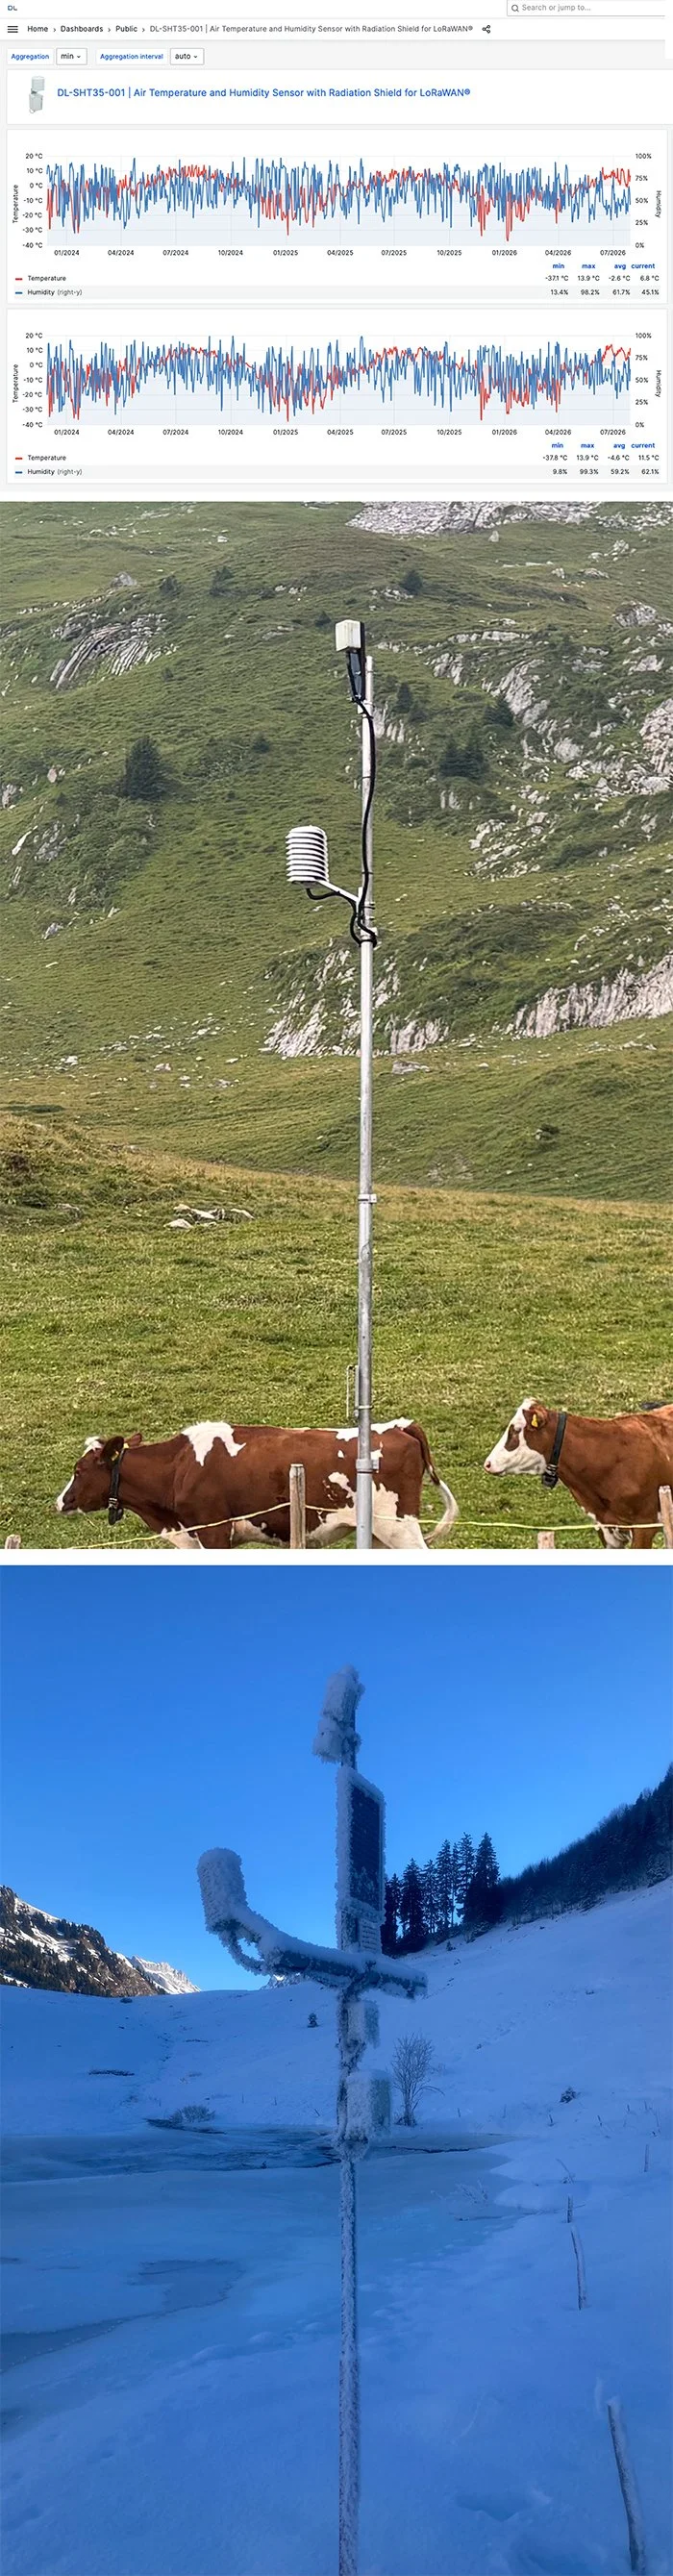
Right now it is summer up there. The mast stands in green pasture, the cows have the place to themselves, and the sensor is measuring the same as everywhere else. In a few months the cold air will start pooling in the hollow again under the right conditions, and the device on the mast will stand above deep snow, exposed to hard frost.

Cold air does not rise. On clear, windless nights it does the opposite: air cooled at the ground grows dense, sinks down the slope and gathers at the lowest point of the terrain. In a closed hollow it has nowhere to go. It pools, and it deepens through the night.

Switzerland's lowest temperatures are not measured on summits. They are measured in dips.

A private research project monitors two of them. At each site, a DL-SHT35-002 records air temperature and relative humidity over LoRaWAN.

In that time both hollows have gone below −37 °C, in the past one of them reached even below -42 °C.

We are not naming the sites. The project's real-time data drew visitors — some arriving in extreme cold without adequate equipment, some camping in protected terrain, some disturbing the measurement field. 

Key facts

Full specs, accuracy, ranges, payload format and more in the datasheet.

Download DL-SHT35 datasheet

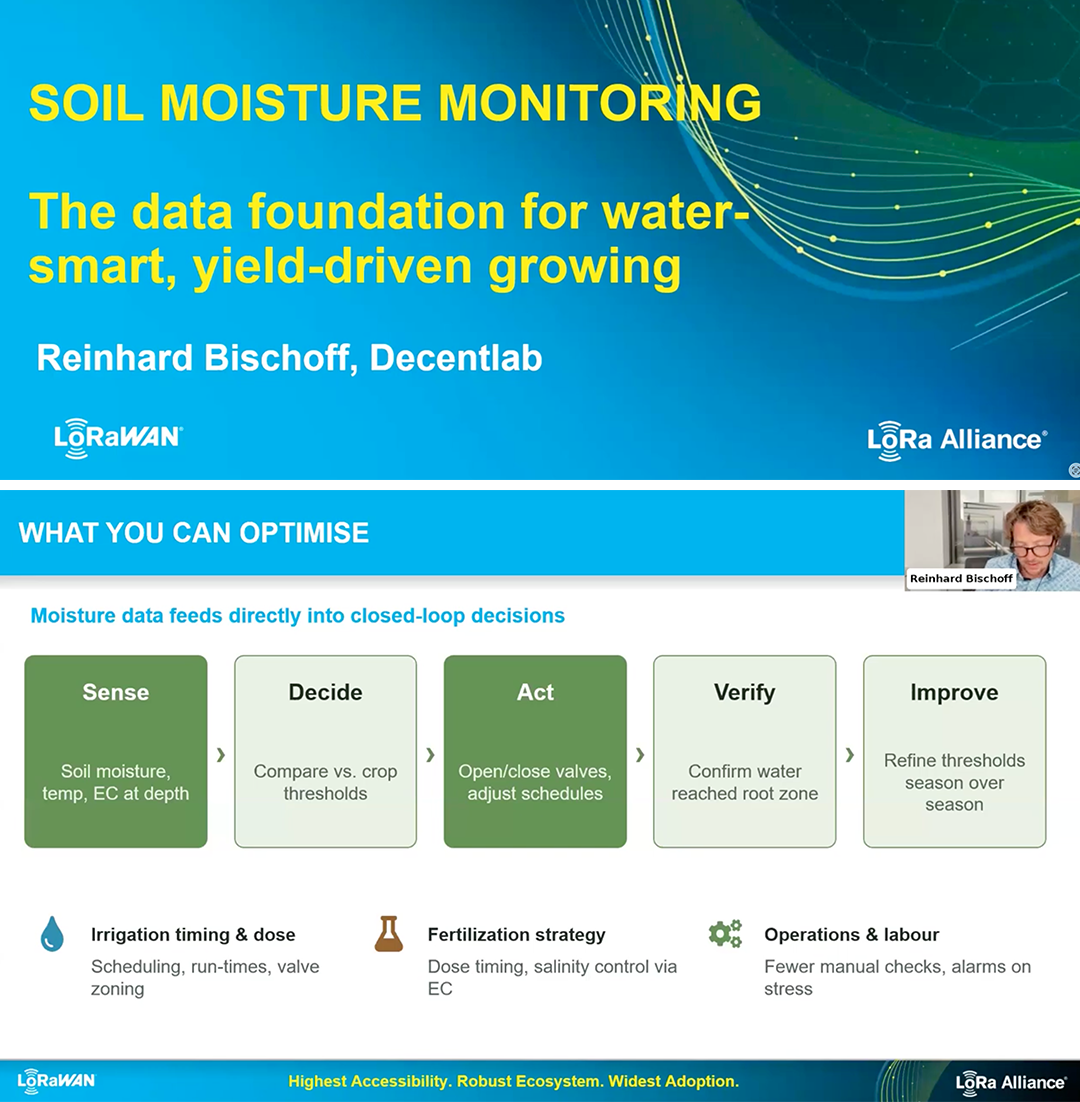
Precision at Scale: Decentlab at the LoRa Alliance agriculture webinar

Agriculture operates across distance, variability and risk. Fields run for kilometres, assets sit well beyond reliable infrastructure, and decisions hang on weather, markets and regulation. The pressure keeps rising at the same time: higher yields, fewer inputs, responsible water management, biodiversity protection, measurable sustainability. Connectivity has stopped being a convenience and is becoming foundational infrastructure.

The hour was laid out along soil, water and crop systems: continuous soil monitoring as the basis for irrigation scheduling driven by real field data rather than calendar assumptions, distributed sensing across reservoirs, pumps and flow rates, microclimate and leaf wetness feeding predictive models for pest and disease risk. The business case was part of it as well — agricultural IoT has to move beyond pilots and deliver measurable return through yield, input reduction, labour efficiency, water savings and compliance reporting.

Decentlab's contribution covered soil moisture monitoring: why it is the single most useful measurement you can make in the root zone, and how continuous data turns irrigation from guesswork into a decision.

→ Explore Decentlab's soil moisture monitoring solutions

Watch webinar

Dortmund is measuring its heat — with Decentlab sensors

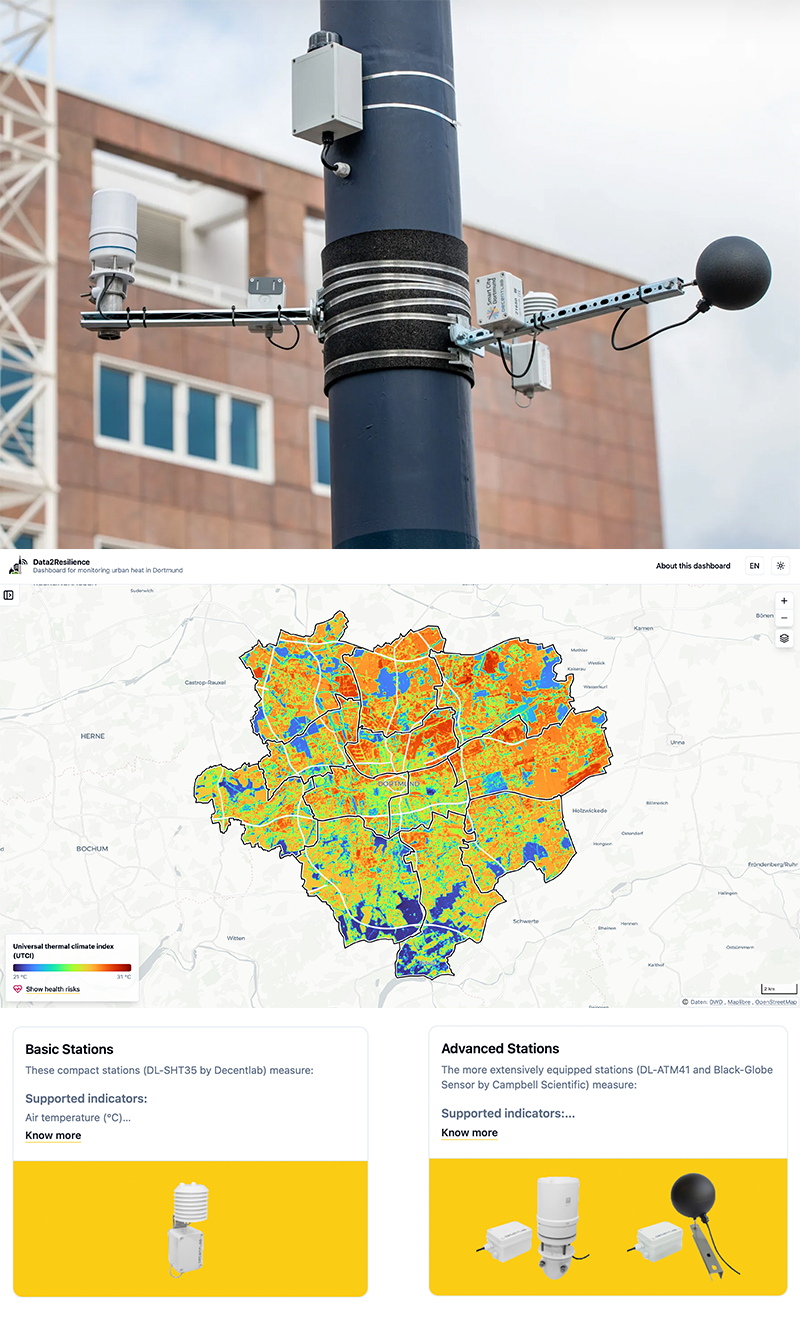
Since summer 2025, a city-wide climate network has been mapping how heat spreads across Dortmund, Germany — running on many of our sensors.

The network covers 76 locations across the city, with every station mounted on a streetlamp and connected via LoRaWAN, delivering a fresh reading every few minutes. 

Two station types are in use:

  • Compact stations carry the DL-SHT35, measuring air temperature and humidity.

  • Extended stations combine the DL-ATM41 weather station with the DL-BLG black globe sensor, capturing wind, precipitation, solar radiation and more — and feeding into the UTCI (Universal Thermal Climate Index) that reflects how heat actually feels.


The data informs the city's heat action plan, its early warning systems, and its urban planning. Where would street trees help most? Which neighbourhoods barely cool down at night?

All of it is public: an interactive dashboard shows the current conditions at every location, hour by hour.

Explore the dashboard

More about the project

What our DL-TRS12 has seen since 2016

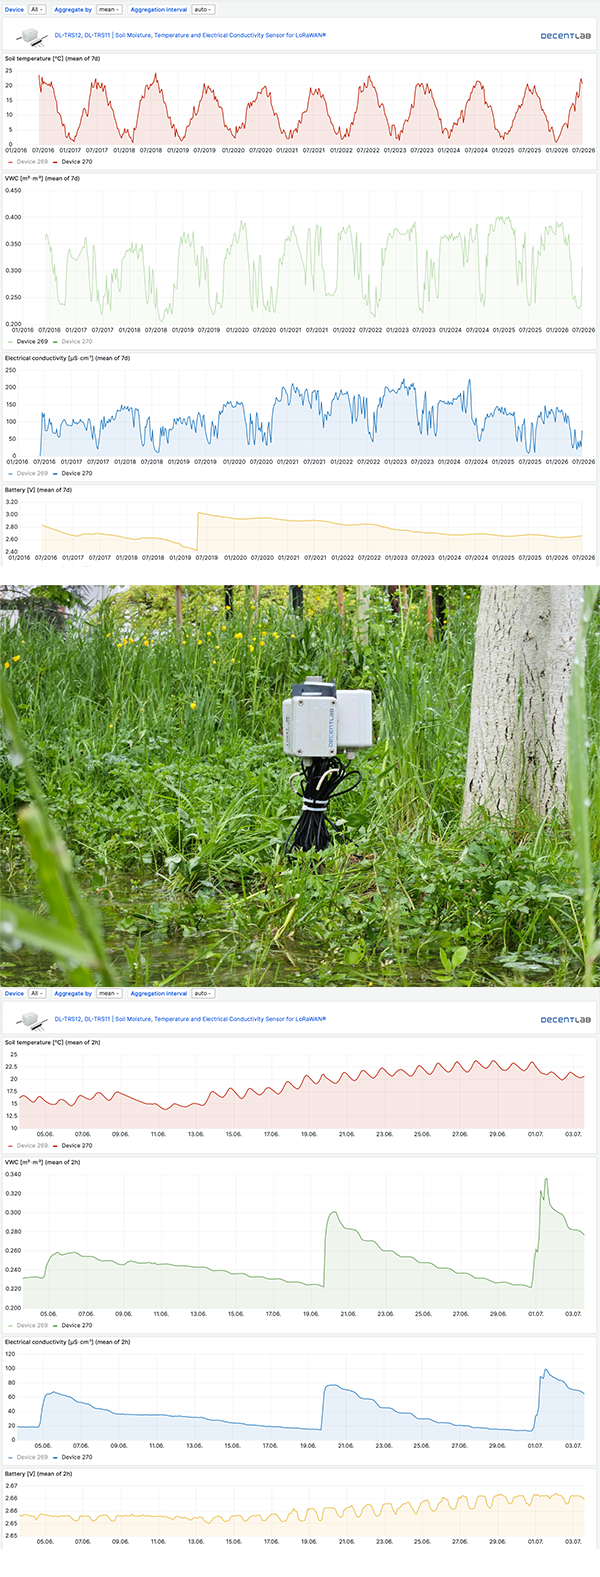
Since 2016, this sensor has measured soil moisture, temperature and electrical conductivity. The temperature traces ten annual cycles: into the twenties in summer, close to 0 °C in winter. The third channel, conductivity, is bulk EC — closely coupled to water content. More water means more conductive pathways, not automatically more nutrients.

Zoom in on the last few weeks. A hot, dry early summer. Then, on 19 June, a severe thunderstorm over the Zürich region — in the hours that follow, soil moisture and conductivity climb. The soil dries down again. And on the night of 1 July, heavy rain returns. In the soil it becomes an almost vertical jump. The rain falls above ground. What the DL-TRS12 shows is how much of it reaches the soil.

Key facts

  • Sensor: DL-TRS12 — soil moisture, temperature, electrical conductivity

  • Running since: 2016

  • Power: 2× alkaline C batteries

  • Maintenance: almost none

Full specs, accuracy ranges, payload format and more in the datasheet.
Download DL-TRS12 datasheet

Explore real-time data from this sensor on our demo site.
Visit DL-TRS12 real-time demo

When the road sweats: a heat test at the SMARTinfeld Living Lab

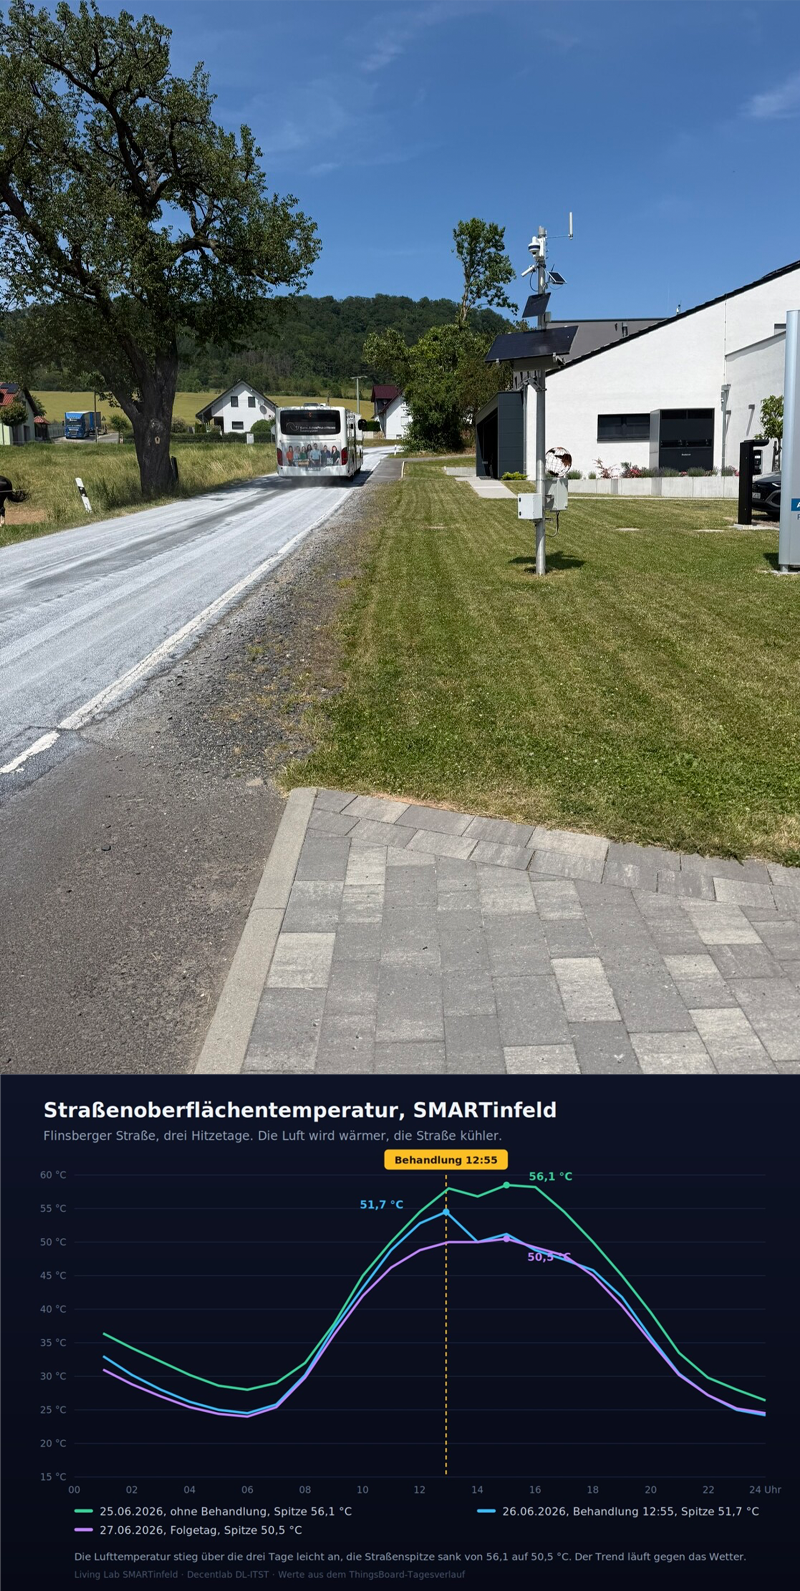
Three days, one measurement mast, a surprising pattern: as the air got warmer, the road surface cooled down. The test was documented by our customer and partner iot-shop (Alpha-Omega Technology), which runs the SMARTinfeld Living Lab in Germany.

Two of the data streams come from Decentlab sensors: the DL-ITST-002 | Infrared Thermometer / Surface Temperature Sensor for LoRaWAN®measures the road surface temperature contactlessly, the DL-ATM41 | Eleven Parameter Weather Station for LoRaWAN® provides measurements of air temperature, humidity, wind speed, solar radiation and much more. Traffic counting is handled by two third-party systems.

In heat, asphalt softens, the bitumen rises to the surface and the road "bleeds" – it turns shiny, sticky and loses grip. Whether a bright-coloured surface treatment helpsbecame clear in the test. The temperature curve from the DL-ITST-002 shows it: on 25 June, with no intervention, the road climbed to 56.1 °C. On 26 June, after a bright-coloured layer was applied, the peak dropped to 51.7 °C – despite warmer air. On 27 June, the hottest day, it stayed at 50.5 °C, and the effect lasted into the next day.

That it wasn't the weather is confirmed by the DL-ATM41: the untreated 25 June had the most variable radiation yet the highest road temperature – if clouds were the cause, it would be the other way round. And the two traffic systems pinned down the moment of treatment. Only all sources together give the full picture.

The interesting part is the comparison with a method tested at the same time: cooling asphalt with water daily. Water works instantly, but only while it evaporates – a light surface keeps working passively. And in a summer when water is scarce and agriculture is struggling, iot-shop raises the fair question of how sensible it is to evaporate water onto roads. Such trade-offs are better made with data than gut feeling.

Decentlab products in the IoT-Shop

Read the full story by iot-shop

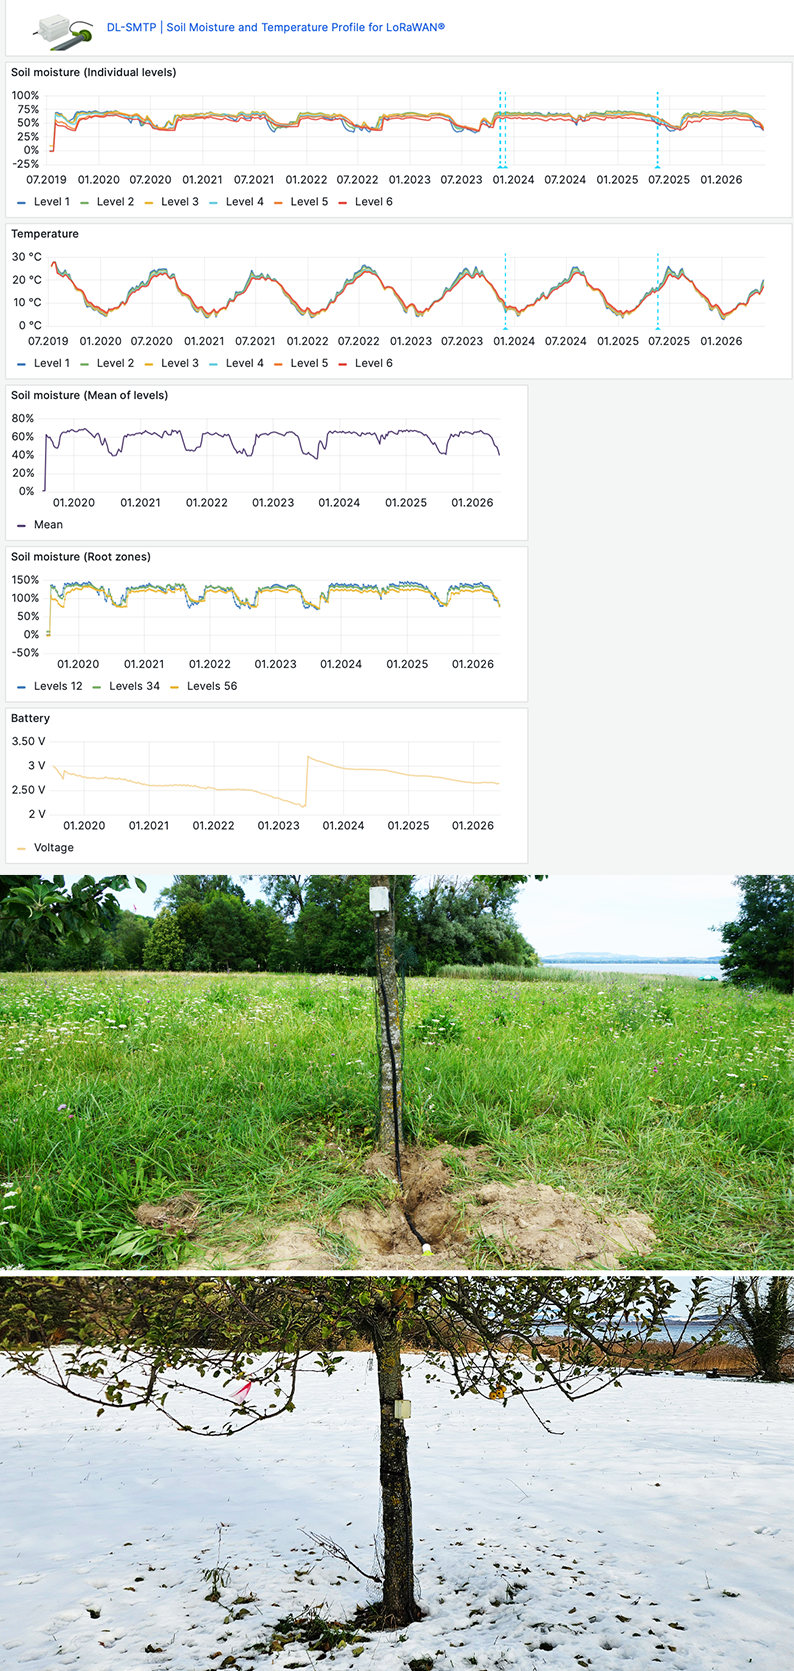
What our DL-SMTP has seen since 2019

Same tree, same device, same probe in the ground. Everything else changes.

Installed in Guévaux on Lake Murten, Switzerland in July 2019, the DL-SMTP | Soil Moisture and Temperature Profile for LoRaWAN®measures soil moisture and temperature at six levels along its 600 mm profile. Polycarbonate enclosure (IP67), running continuously — no recalibration.

Snow in the winter photo. In the soil data for the same period: none of the six levels ever drops below 0 °C. The moisture follows the same rhythm each year — high in winter, a late-summer drop, recovery in autumn.

The DL-SMTP is built for places where soil water drives decisions: irrigation control, smart agriculture, tree plantations, and parks. Six levels along the same profile show not just whether the surface is dry, but how far down the water has reached — and where it hasn't.

Key facts

  • Sensor: DL-SMTP, soil moisture and temperature at 6 levels along a 600 mm profile

  • Probe: very robust design, 600 mm length, 32 mm shaft diameter

  • Measurement interval: 10 minutes

  • Power: 2× alkaline C batteries

  • Running since: 2019

  • Maintenance: almost none

Full specs, accuracy ranges, payload format and more in the datasheet.
Download DL-SMTP datasheet

Explore real-time data from this sensor on our demo site.
Visit DL-SMTP real-time demo

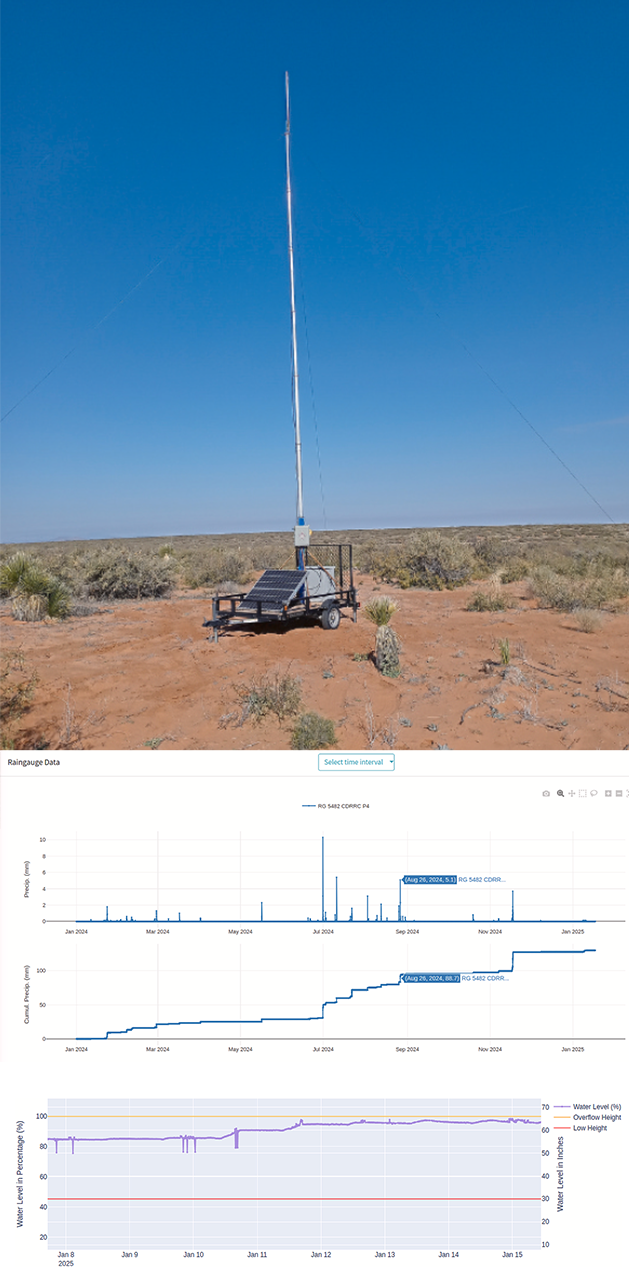
Decentlab sensors deployed across 500,000 acres of US rangeland

A new study in Computers and Electronics in Agriculture presents an end-to-end IoT and remote sensing platform for extensive livestock management — with Decentlab sensors as part of the infrastructure.

While precision agriculture is well established in crop farming, it has struggled on vast, remote rangelands due to limited connectivity, no grid power, and large, heterogeneous data streams. The platform addresses this by collecting animal, water, and weather data over LoRaWAN and turning it into actionable insights for grazing management.

It was deployed across 12 ranches in four US states and more than 500,000 acres of arid rangeland, with 931 cattle tracking collars, 19 water-level sensors, 7 rain gauges, and 27 LoRaWAN gateways.

Where Decentlab fits in
The platform uses Decentlab sensors for water and precipitation monitoring, each reporting every 10 minutes:

To date, the platform has processed 130.4 million collar data packets, 2.9 million water-level measurements, and 810,000 rain gauge readings.

What the study found
This is the first fully validated end-to-end system of its kind in operational use — not a pilot, but a deployment across all twelve ranches. The authors credit it with the potential to improve efficiency, reduce labor and costs, and support animal welfare.

Read the study

Sensing Rome's microclimate

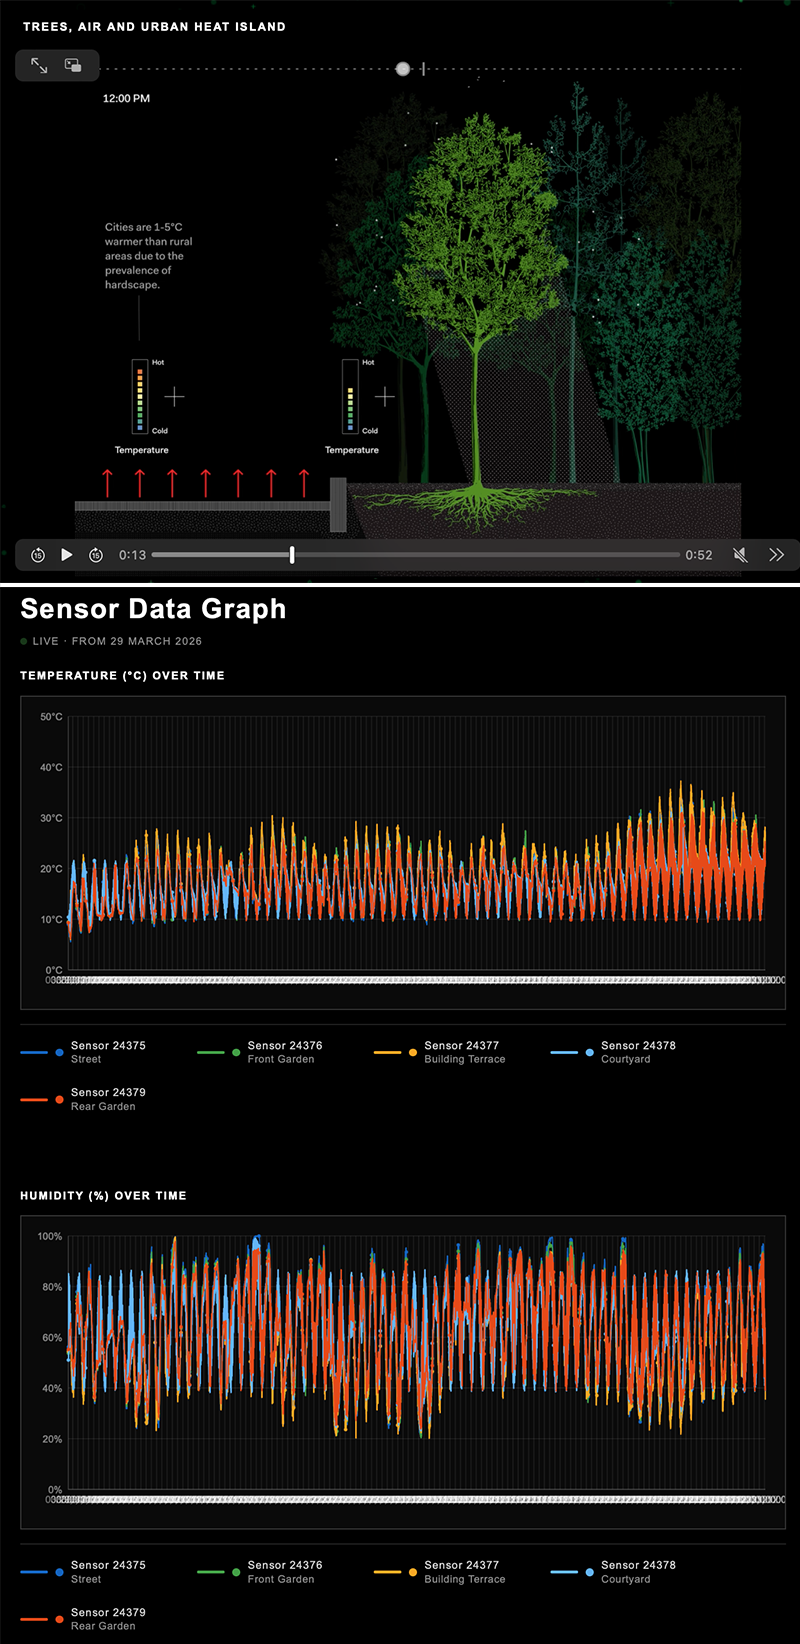
Atmospheric Commons is a project by researchers from Harvard GSD (Craig Douglas & Max Piana), and ETH Zurich (Justin Booz). Across the grounds of the American Academy in Rome, a network of 47 sensors continuously measures air temperature and humidity, the relative heat index, soil moisture, and the sap flow of one of the courtyard cypress trees. Decentlab contributed seven DL-SHT35-001 | Air Temperature and Humidity Sensor with Radiation Shield for LoRaWAN® to the network.

The project builds on earlier work, including the Cool Forest installation at the 2025 Venice Architecture Biennale — a planted pavilion in the Arsenale where sensors measured the cooling effect of trees adapted to Venice's future climate. From Venice to Rome, the same question: how do trees shape the air around them, and how can we design cities that work with that?

The premise: trees are not passive background, they are active climatic infrastructure. Through transpiration, shading, and pollutant absorption, they generate microclimatic cooling fields that mitigate the urban heat island effect. The sensor network in Rome makes those processes visible — turning the Academy's gardens into a living laboratory for climate-responsive urban design.

More about the project and live data: atmosphericcommons.com

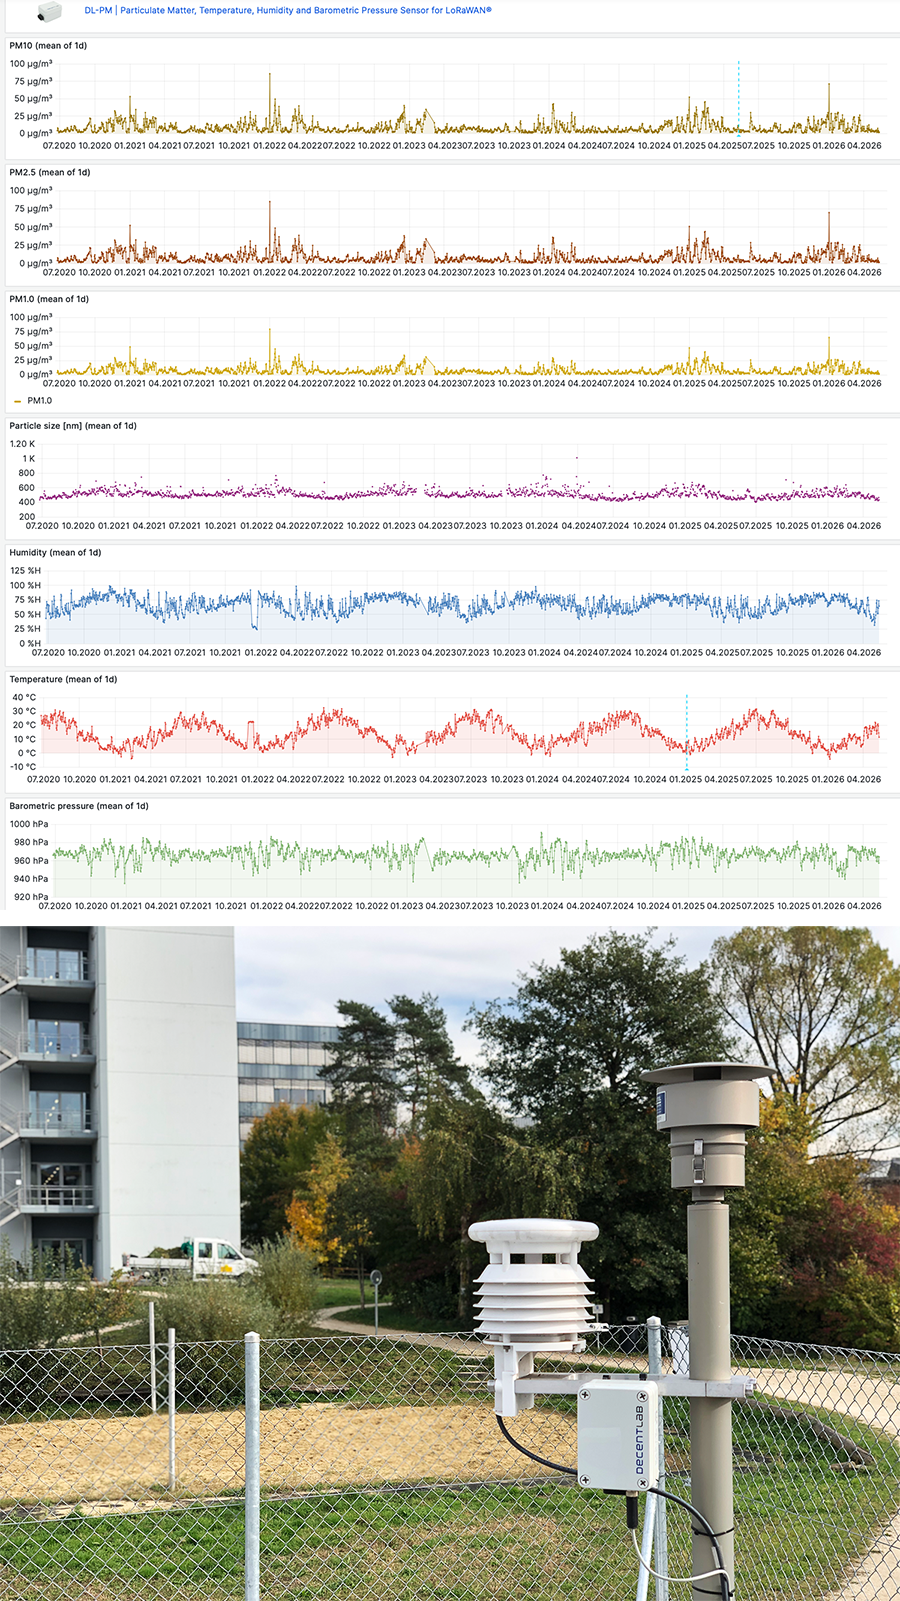
What our DL-PM has seen since 2020

Almost six years of continuous data — from a single DL-PM | Particulate Matter, Temperature, Humidity and Barometric Pressure Sensor for LoRaWAN® in Dübendorf. Measuring PM1, PM2.5, PM4, PM10 — plus temperature, humidity, and barometric pressure. Every 10 minutes, around the clock.

Almost six years on, every season has left its trace.

Winter brings the most dramatic peaks — sharp New Year's Eve spikes from fireworks, and stubborn inversions that hold PM elevated for days at a time. The highest New Year's Eve PM concentrations in our dataset were in 2021/22. Other years were notably smaller. Weather, wind, and human behavior all leave their trace.

Spring and summer look calmer at first glance — but never flat. Traffic, construction, secondary aerosols, Saharan dust transport, and increasingly, wildfire smoke from southern Europe all show up. Just without the winter extremes.

Year-round, temperature and humidity trace clean annual cycles — six clean waves, same sensor, same site. The kind of validation you only get from multi-year continuous measurement.

No recalibration. No maintenance worth mentioning. Just the air, quietly recorded and sent wireless over LoRaWAN® 24/7.

Key facts

  • Sensor: DL-PM (PM1 / PM2.5 / PM4 / PM10 + temperature, humidity, barometric pressure)

  • Running since: July 2020

  • Measurement interval: 10 minutes

  • Power: 2× alkaline C batteries + external 5V supply for PM module

  • Maintenance: almost none

Full specs, accuracy ranges, payload format and more in the datasheet.
→ Download DL-PM datasheet

Explore real-time data from this sensor on our demo site.
→ Visit DL-PM real-time demo

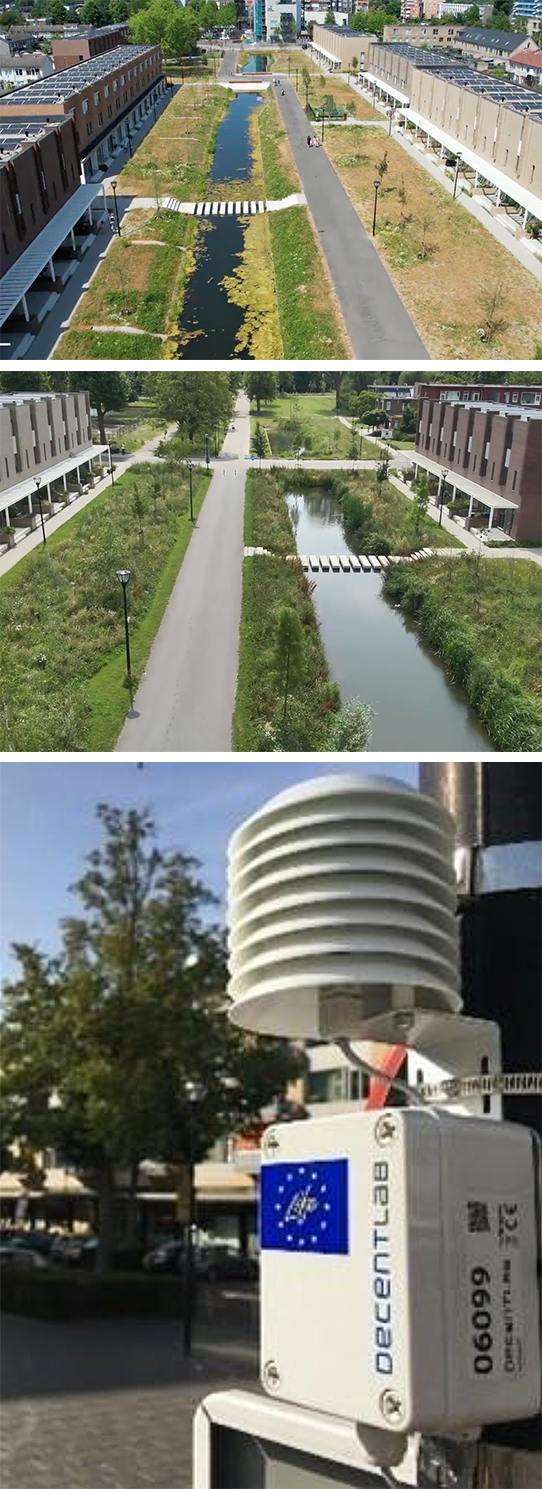
From asphalt to canals: 6 years of climate data from the Netherlands

What happens to a neighbourhood's climate when you replace roads with trees and water? Between 2019 and 2025, the European LIFE Critical project measured exactly that in a Dutch city district. Led by the Municipality of Dordrecht and OnePlanet Research Center, two areas were transformed: an asphalted road corridor became a landscape of canals, footpaths, and trees, and the local park was upgraded with new water features and denser vegetation.

A sensor network monitored temperature, humidity, nitrogen dioxide, and particulate matter. A network of 15 Decentlab DL-SHT35-001 | Air Temperature and Humidity Sensor with Radiation Shield for LoRaWAN® recorded temperature and humidity across park, residential, and roadside locations.

Key findings

  • Park and blue-green areas were consistently cooler than built-up zones, with the strongest effects during heat events.

  • Results suggest the transformation reduced extreme temperature differences from 1.4 °C to 0.9 °C.

  • NO₂ concentrations were systematically lower in green and low-traffic areas.

Feedback from the project team
"Over these years they showed excellent stability and time coverage, they helped us quantify the climate differences between residential and park areas, and compare conditions before and after an urban transformation. Thanks for your continued support — we are glad to have worked with such a reliable company."

Read the Final Monitoring Report for the full results.

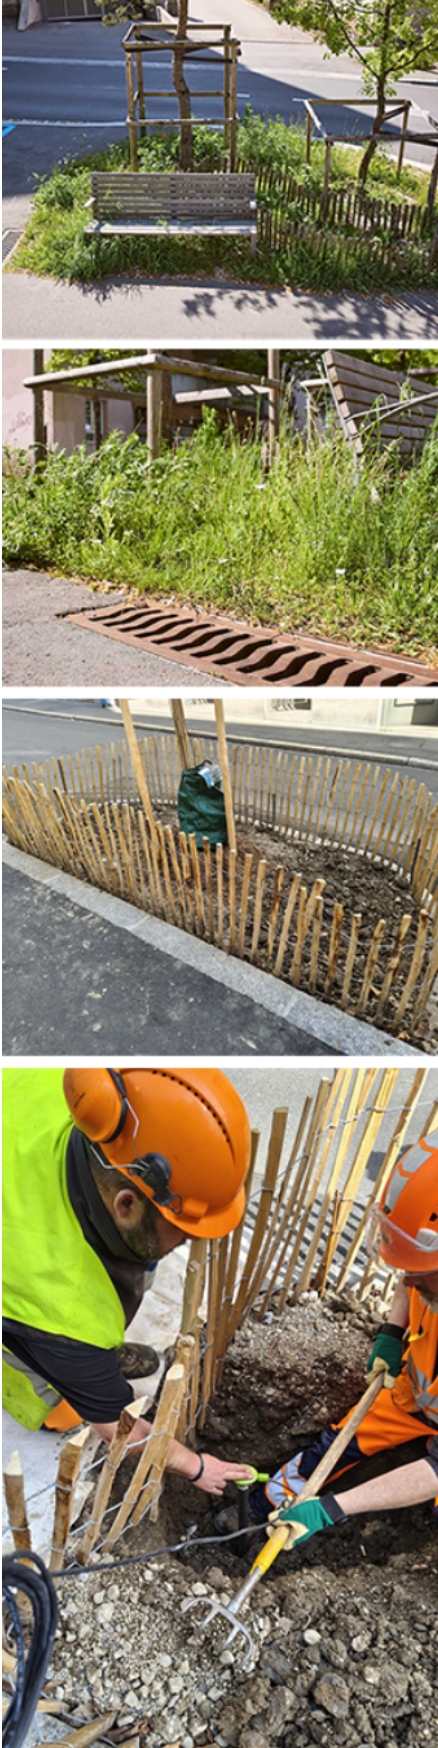
Lausanne's sponge city: DL-SMTP measures how trees use rainwater

What if every city tree had its own rainwater reservoir? That is exactly what the Impluvium tree pit is designed to deliver — a system created specifically for Lausanne's ecosystem, building on the well-known Stockholm tree pit. Instead of letting rainwater drain away or flow into the sewer, it is stored directly under the tree, in a special biochar-based substrate (TP70) that is at once load-bearing, fertile and water-retaining. During dry spells the pit supplies the tree; during heatwaves it cools the surroundings by up to 4 °Cthrough evapotranspiration. Pilot trials also show that 70 to 100 percent of micropollutants in the runoff are retained in the substrate.

But does it still work on a slope? At a Lausanne impluvium pit on a 12 percent gradientHEIG-VD and the City of Lausanne's Service de l'eau are investigating exactly that — the case where water runs off particularly fast. Soil moisture and soil temperature are monitored using our DL-SMTP | Soil Moisture and Temperature Profile for LoRaWAN®. The project is just getting underway, with first results expected soon.

We are looking forward to the findings and will keep you posted.

More on the concept: Impluvium tree pit

→ See our sensors for soil & plant management

6 years. Almost no maintenance.

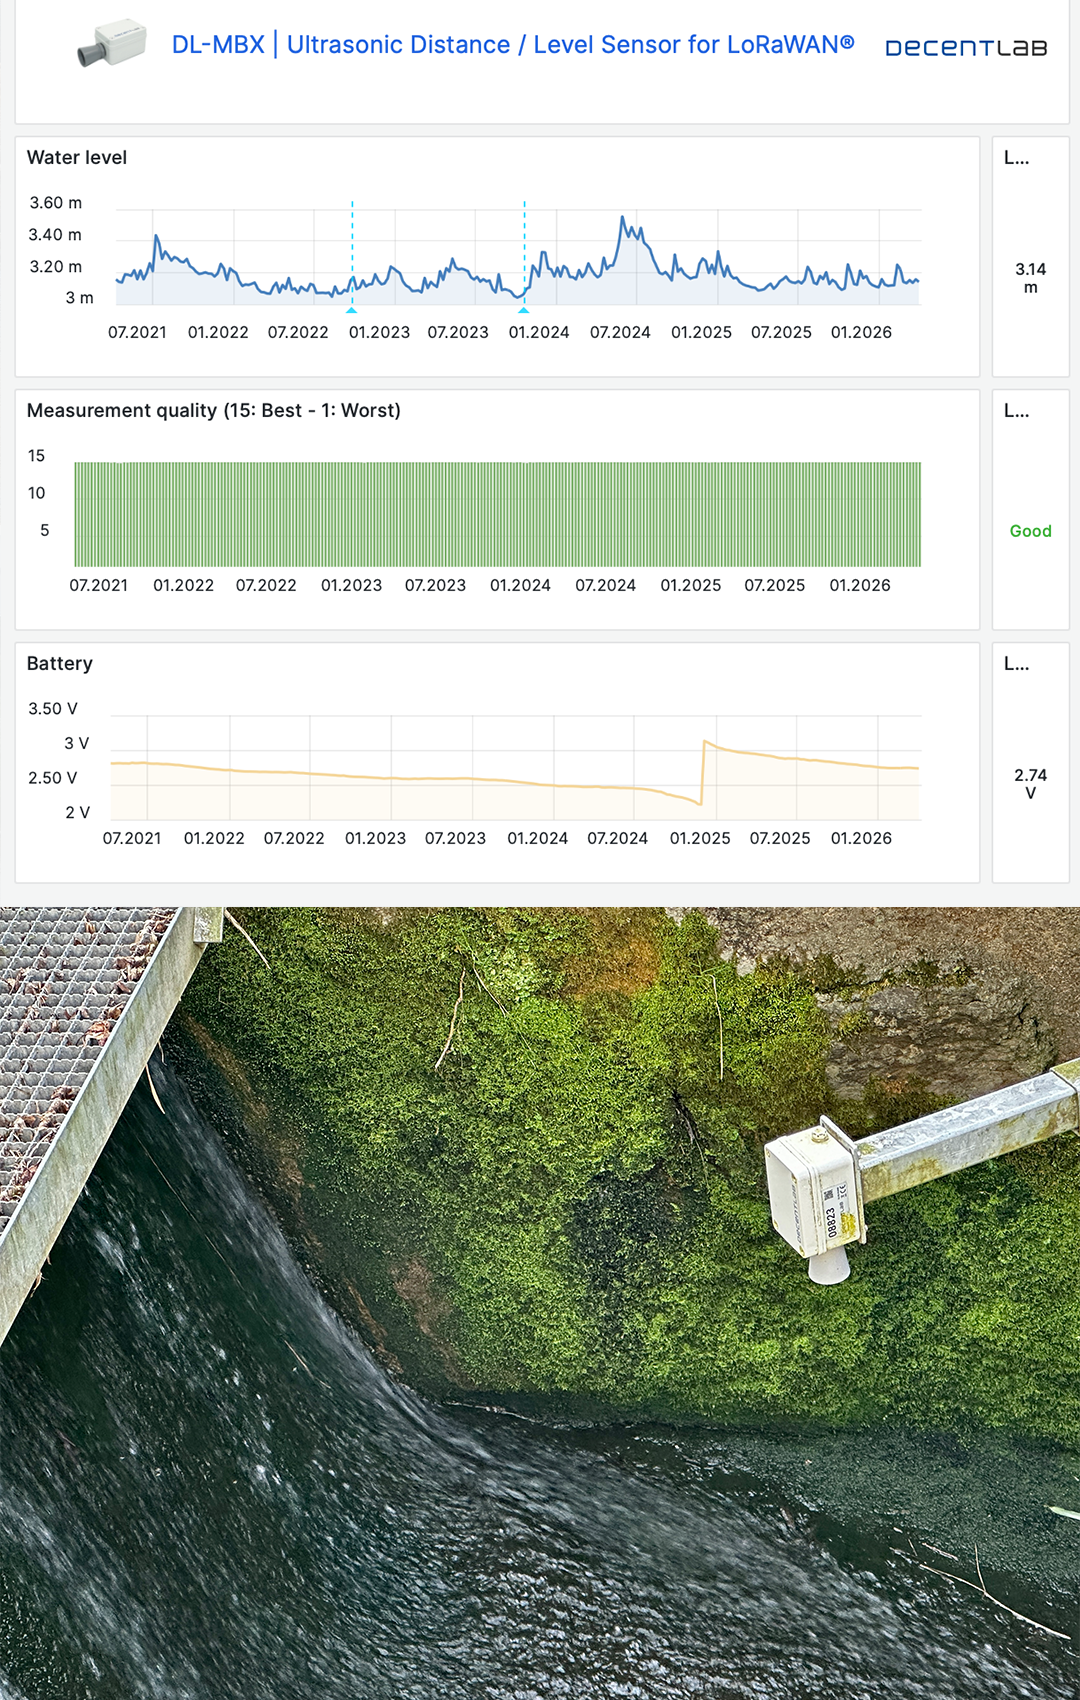
In June 2020, we installed a DL-MBX | Ultrasonic Distance / Level Sensor for LoRaWAN® at our site in Dübendorf, Switzerland. Batteries in, mounted, done.

We haven't touched the device since. Six years later: measurement quality still "Good". The data clearly shows seasonal water level patterns — and one peak stands out. In June 2024, severe flooding hit Switzerland, causing 905 million francs in damageLake Zurich reached danger level 4. Our sensor captured it all in real time.

No recalibration. Just six years of continuous, reliable data.

Key facts

  • Sensor: DL-MBX, ultrasonic distance / level sensor

  • Running since: June 2020

  • Measurement quality: Good

  • Measurement interval: 10 minutes

  • Maintenance: almost none

Full specs, battery life calculations, payload format and more in the datasheet.
→ Download DL-MBX datasheet

Explore real-time data from our sensors on the demo site.
→ See DL-MBX real-time demo

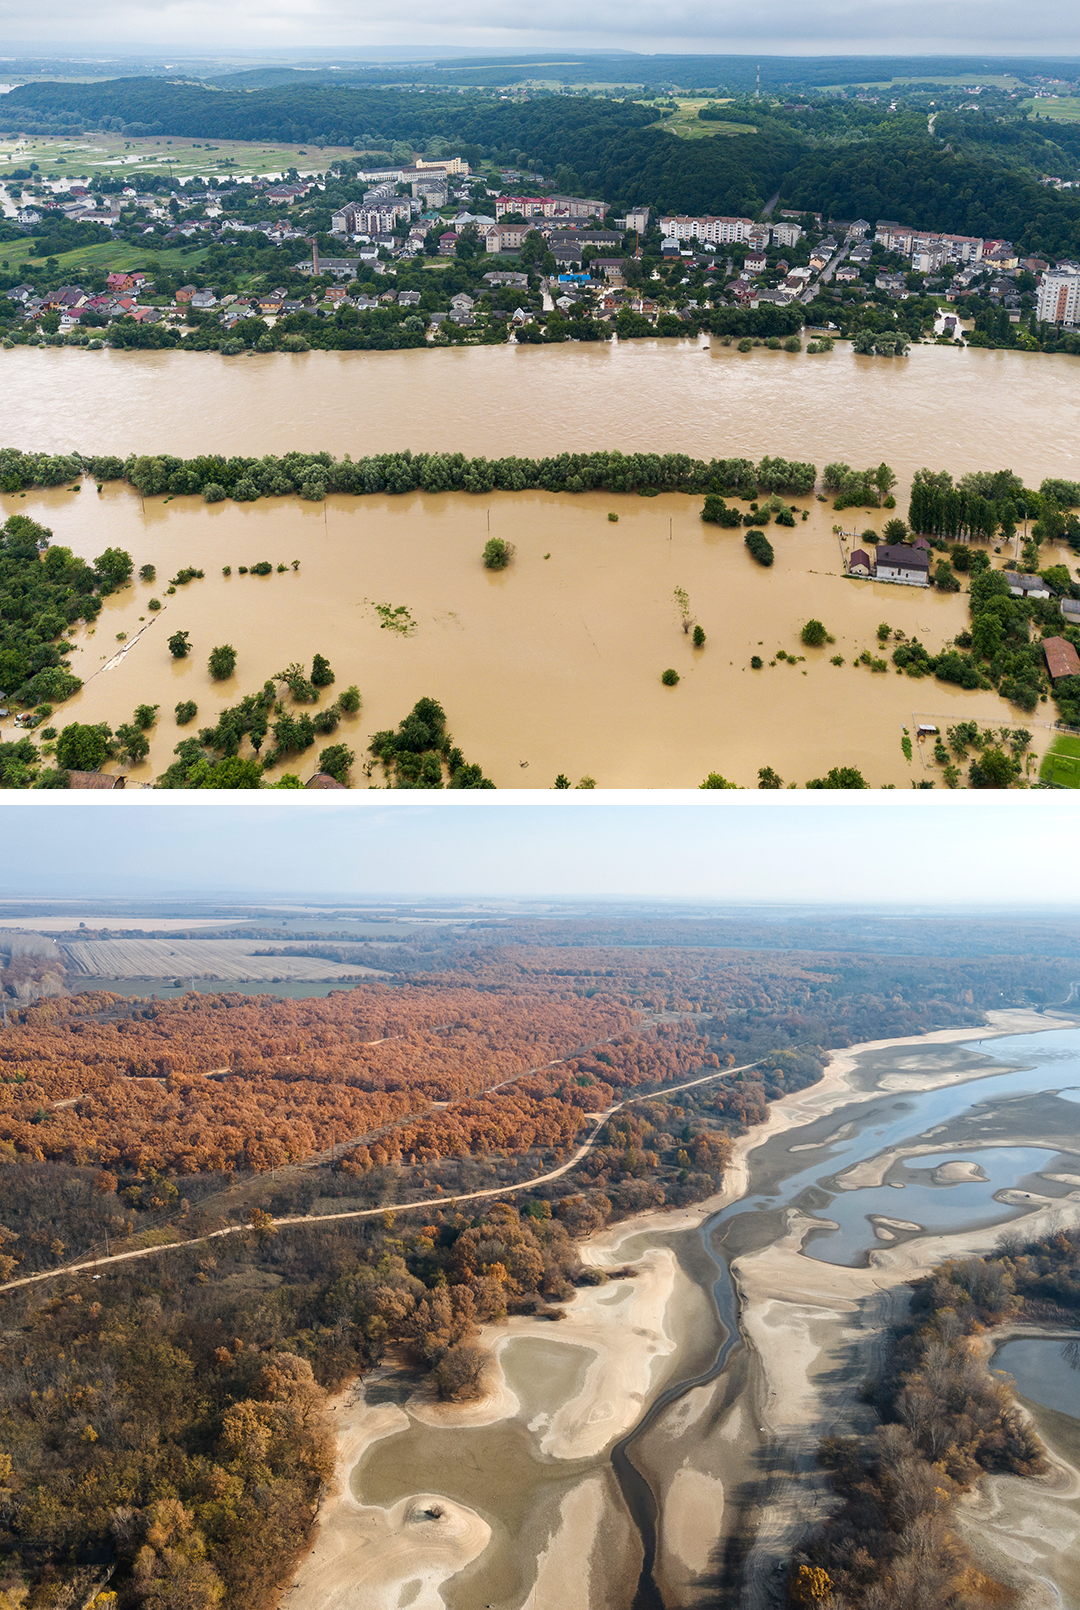
What if you could simulate the next flood or drought before it happens?

Water scarcity is no longer limited to arid regions. Across Europe, recent droughtyears have forced shipping halts on major rivers, triggered irrigation bans, and exposed how quickly agriculture, industry, energy, and drinking water come into conflict over the same resource.

Researchers at Forschungszentrum Jülichare tackling this with a new tool: a digital twin of an entire river basin. The Solution Lab Rur-Erft combines hydrological, agricultural, and economic models into one simulation — letting water managers, authorities, and farmers test drought scenarios and explore trade-offs before they become real. A parallel project in Leipzig, the Solution Lab URBAN LE, applies the same idea to cities. Both are part of the Helmholtz Initiative "Water Security for People and the Environment"and designed to scale to other regions worldwide

The key constraint? Input data. As Dr. Frank Herrmann from Forschungszentrum Jülich puts it: "To ensure that such decisions can be made on a sound basis, we need reliable data on water availability and water demand." Soil moisture, water levels, weather conditions — continuously measured, in real time, across the landscape. That's precisely what decentralised LoRaWAN sensor networks deliver.

→ See our sensors for hydrology & water management

Only 13 countries breathe clean air

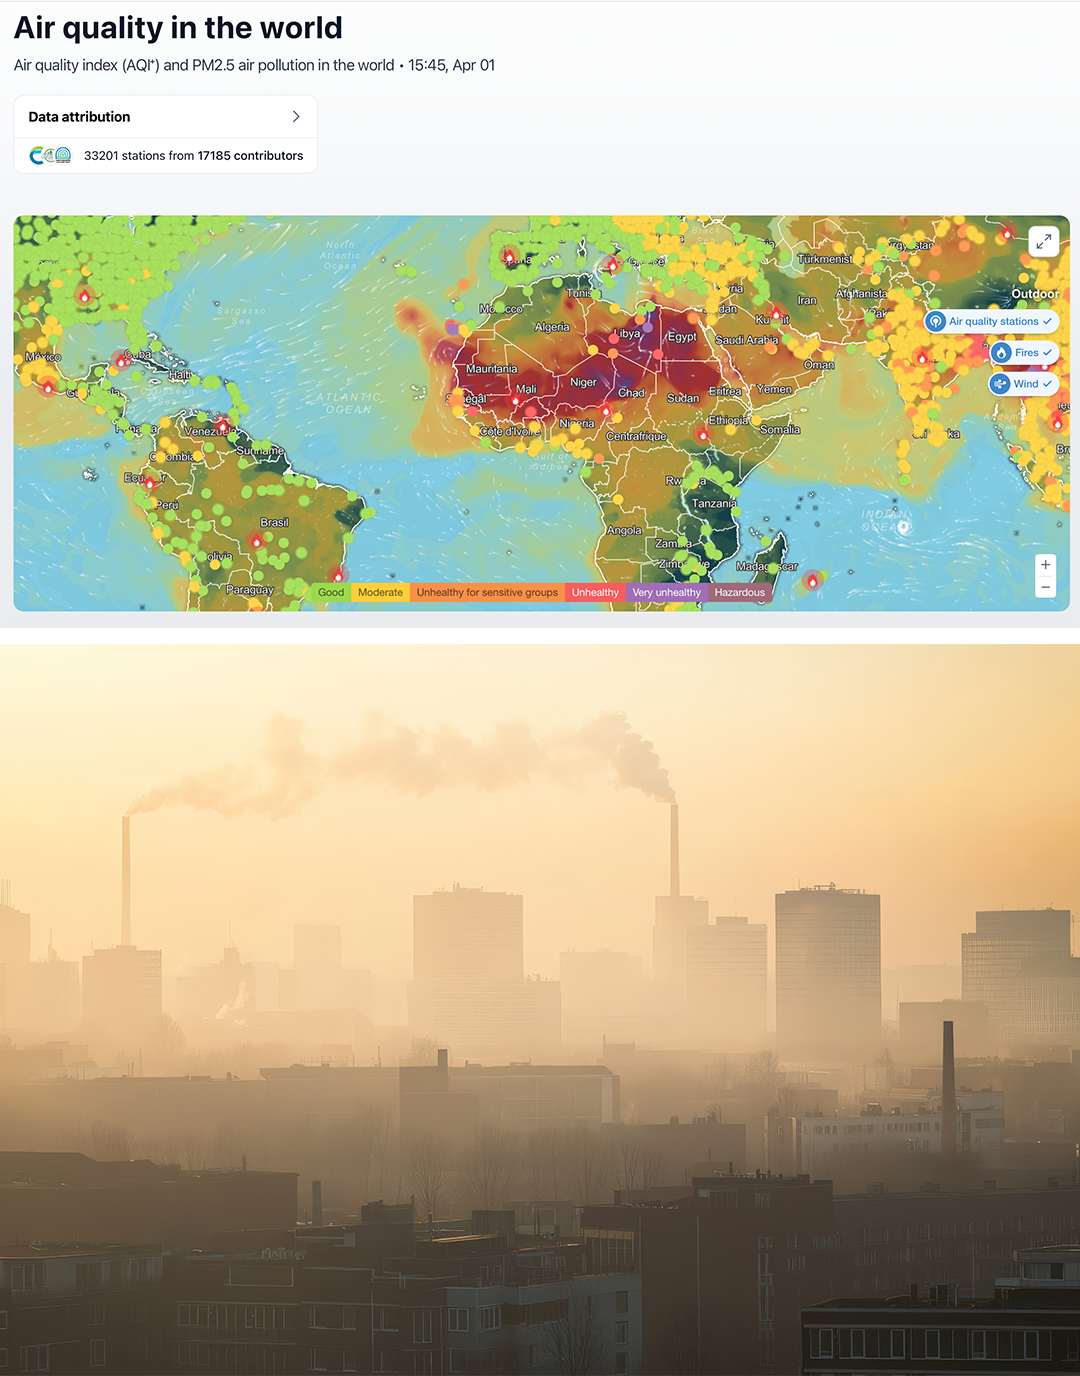
In 2025, only 13 countries worldwide met the WHO guideline for fine particulate matter — including just three in Europe. Switzerland wasn't among them: PM2.5 levels rose, driven by wildfire smoke, Saharan dust, and local emissions from traffic and wood burning. Sources: IQAir: Interactive global map of 2025 and Nationalen Beobachtungsnetzes für Luftfremdstoffe (NABEL) report of 2025

At the same time, the world's ability to track air quality is shrinking. When the US State Department shut down its embassy monitoring programme in March 2025, six countries lost their only source of reliable air quality data — and monitoring was weakened in 44 more.

The conclusion is hard to avoid: centralised monitoring alone is no longer enough. Distributed, low-cost sensor networks are becoming critical infrastructure — to close data gaps, validate models, and give communities the information they need to act.

→ Explore Decentlab's air quality monitoring solutions

The world's weather – a snapshot

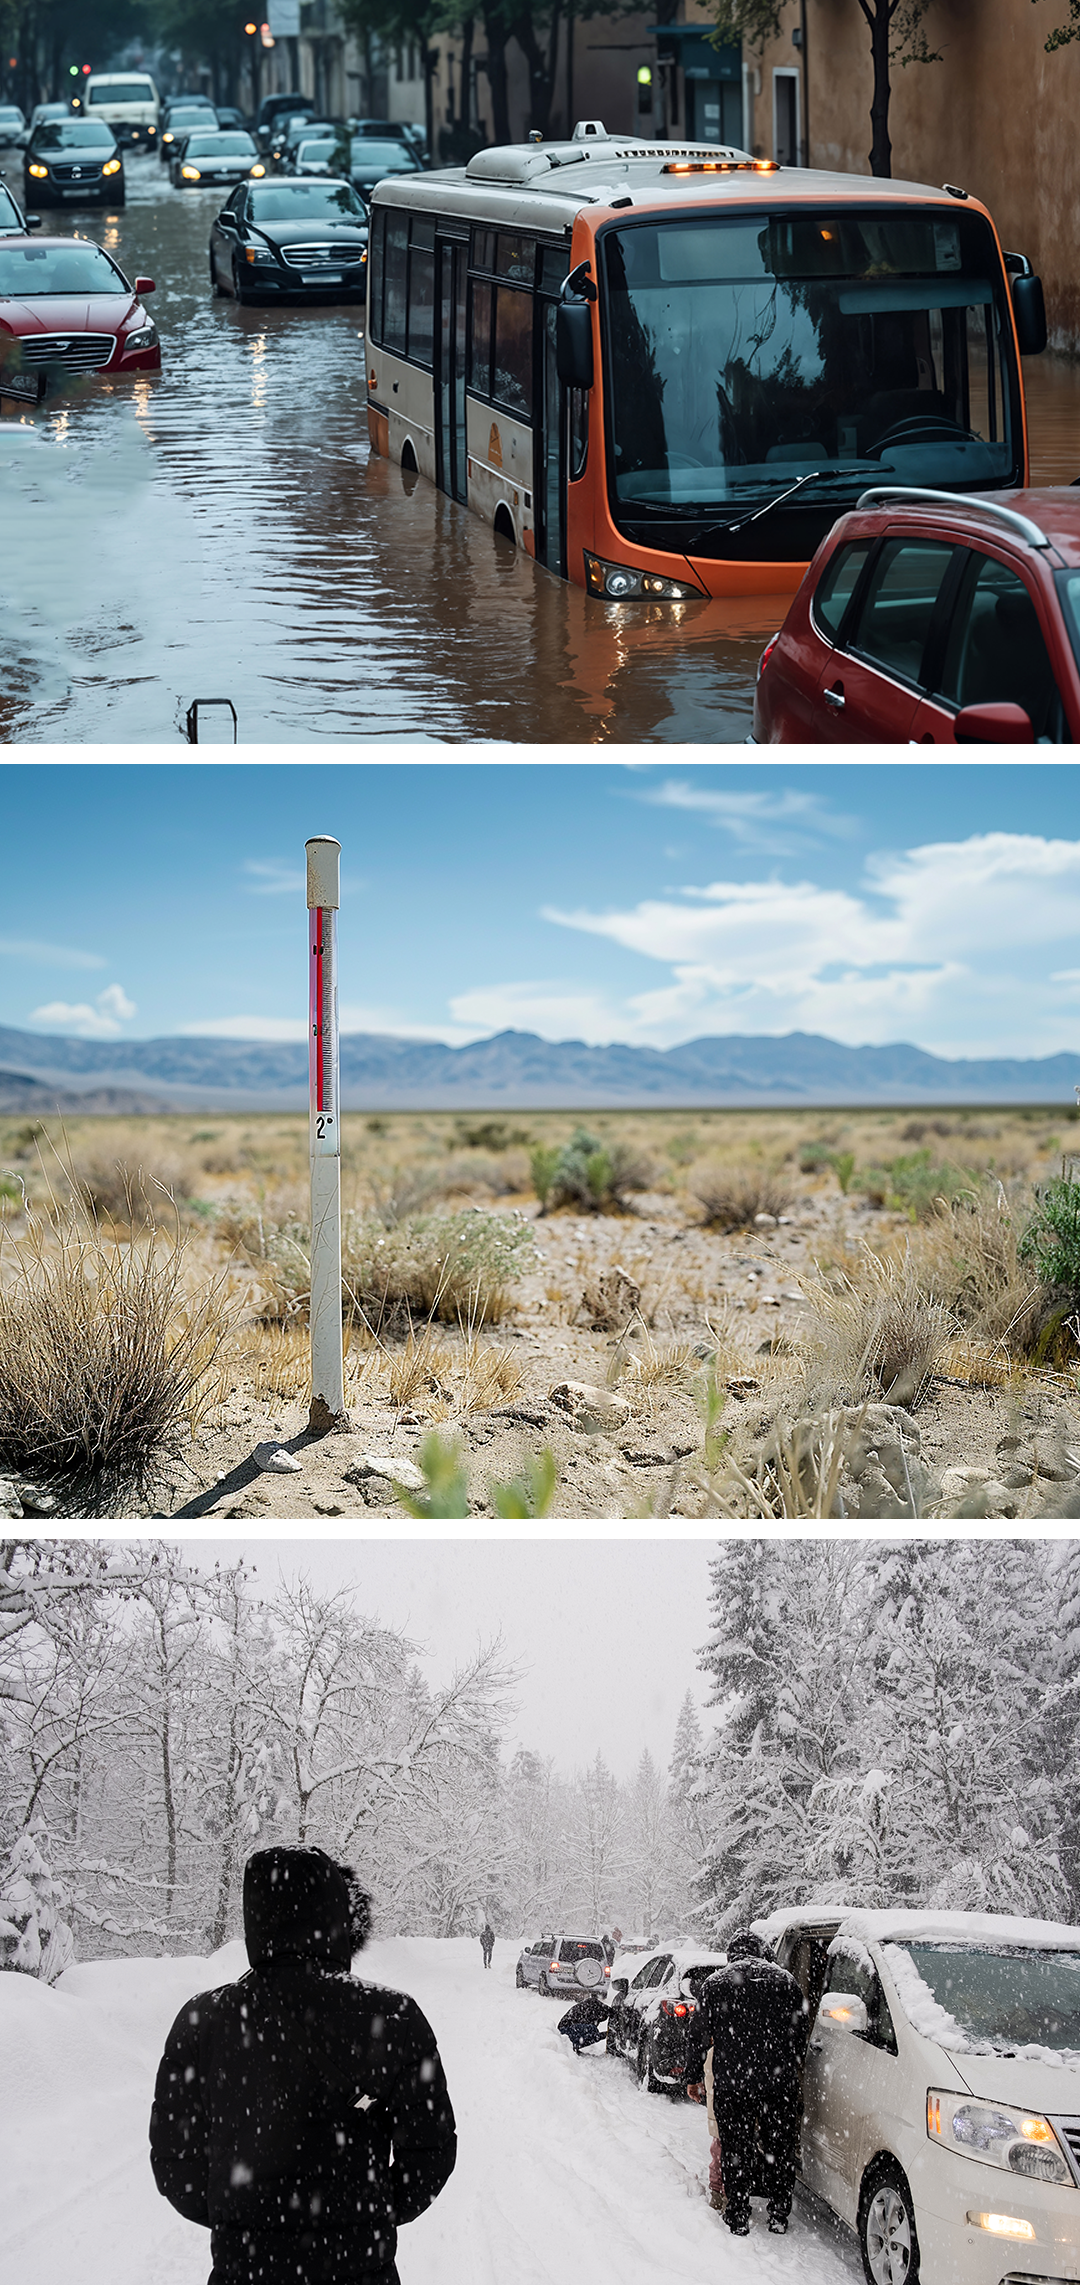
The winter of 2025/26 has been a study in contrasts. By February, Switzerland had barely seen snow — while Japan was buried under two metres of it, with the army called in for disaster relief. Australia recorded local temperatures of nearly 50 degrees and evacuated thousands from bushfires. Storms battered the USA and Portugal. Wildfires swept Argentina.

February made things worse. Intense storms drenched Western Europe and North Africa — France, Spain, Portugal and Morocco all suffered severe flooding. In Ethiopia people died in floods and landslides. In Kenya after torrential rain submerged Nairobi.

The bigger picture: February 2026 was the fifth warmest February on record, sitting 1.49 °C above pre-industrial levels (MeteoSwiss). The science is clear — extreme rainfall and drought are becoming more frequent, and climate change is making them more intense.

This is precisely where continuous environmental monitoring matters. Water levels, soil saturation, snowpack, rainfall intensity — tracked not as one-off readings, but as long-term time series. It is that accumulation of data over months and years that reveals patterns no single measurement ever could: when a slope is approaching its limit, how a river responds to a given storm, which sites are most vulnerable to temperature swings. The foundation for understanding change — and for warning when it counts.

Devices for flood and weather monitoring: 
DL-MBXDL-RADDL-LIDDL-TBRG

Forests under climate stress: Monitoring with Decentlab dendrometers

Climate change is causing trees to leaf out earlier – yet the trunks of many species are growing more slowly.

TreeNet study led by WSL shows that heat and drought limit the growth of spruce, fir, and beech, even during longer growing seasons. Each year, trees have only 40 to 110 effective growth days, and critical dry periods further reduce growth. This impacts carbon storage and timber yields, making it necessary to adapt forest management strategies locally and by species.

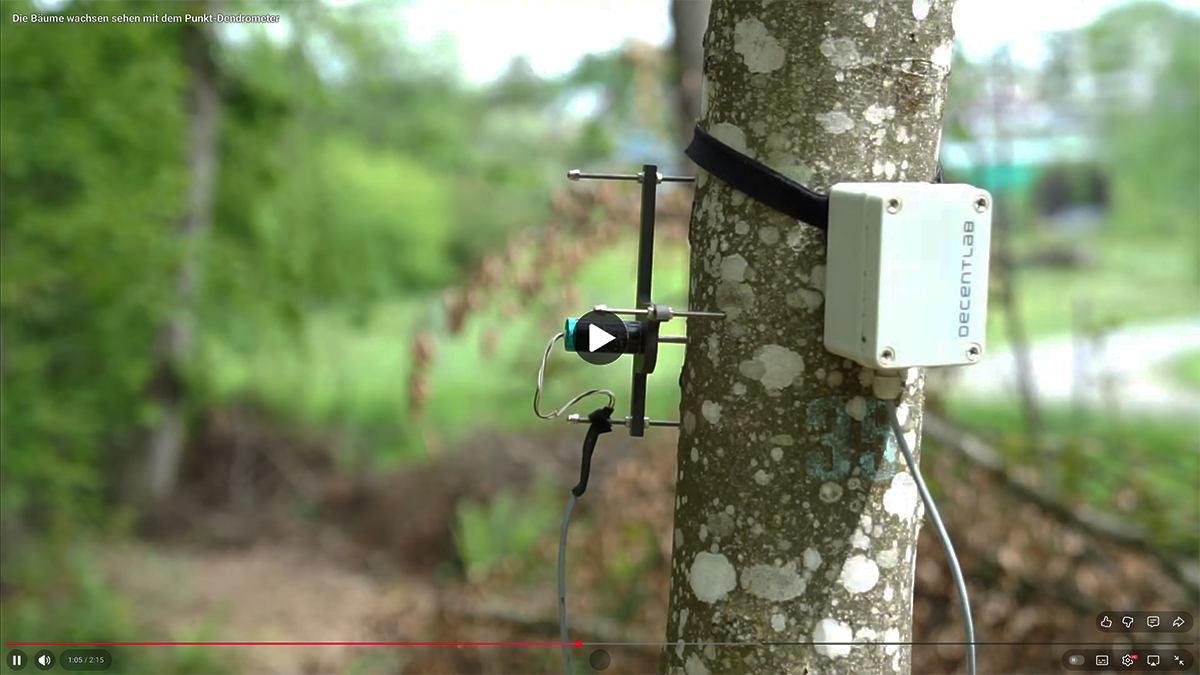
To analyze these effects, researchers are using DL-ZN1-001 | Dendrometer T-shape for LoRaWAN®. Mounted directly on the trunk, they measure micrometer-scale changes in tree diameter and provide hourly data on growth and water balance. This allows researchers to distinguish between actual wood formation and changes caused by water stress.

In total, 228 trees at 48 sites are being monitored. A clear demonstration of the method can be seen in the video “The Thing – Point Dendrometer”.

Read full article
Watch video

Groundwater & soil moisture: Low snow reserves

Due to another above-average mild winter in Switzerland, and despite periods of heavy snowfall in February, the snowpack in low and mid-altitude regions has already largely melted as of March 2026. This missing "snow storage" has direct implications for water reserves in the coming months.

  • Facts 
    With a nationwide average winter temperature of -0.2 °C, this season was 1.6 °C above the norm, ranking as the 6th warmest winter in Switzerland since records began in 1864. While groundwater levels are currently stable thanks to a wet February, total winter precipitation reached only about 70% of the reference value (MeteoSwiss Blog)
     

  • Consequence
    The lack of snow means that "delayed" groundwater recharge through gradual melting will not occur. Simultaneously, the vegetation period has started prematurely: plants are already actively extracting moisture from the soil—water that would normally infiltrate into deep aquifers at this time of year. Without this "snow buffer," summer reserves will depend strictly on upcoming rainfall.
     

  • Monitoring Relevance
    In such a scenario, rain gauges alone do not tell the whole story. Only the direct measurement of soil moisture and local groundwater levels reveals actual water availability. Data from platforms like Trockenheit.admin.ch is therefore of critical importance for municipal planning and agriculture this year.

Devices for Groundwater & Soil Moisture Monitoring: 
DL-PR26DL-PR36DL-PR36CTDDL-SMTPDL-SDD

Peatland restoration: Why precision and decades make the difference

Peatland restoration is one of the most effective nature-based climate solutionsof our time. Because intact peatlands sequester significantly more CO2 per unit area than forests, they are indispensable as natural carbon sinks.

However, a recent meta-analysis published in the journal Water "Issues of Peatland Restoration Across Scales" – reveals that many projects fall short of their potential due to a lack of precise monitoring.

Three Core Challenges Identified by the Study:

  • Spatial Scaling: Peatlands function as large-scale hydrological systems. Collecting data only from small test plots often leads to significant miscalculations of the actual CO2 balance of the entire area.
     

  • The Methane Risk: Without exact water level control, restored areas can emit methane – a gas far more potent than CO2 in terms of climate impact. The authors therefore call for real-time monitoring capable of capturing even the finest fluctuations in water levels.
     

  • Temporal Continuity: Ecosystems evolve over decades. According to the meta-analysis, short-term studies (1–2 years) are not representative; instead, seamless data series spanning many years are required.

These scientific requirements underscore the importance of high-precision sensor technology in environmental research.

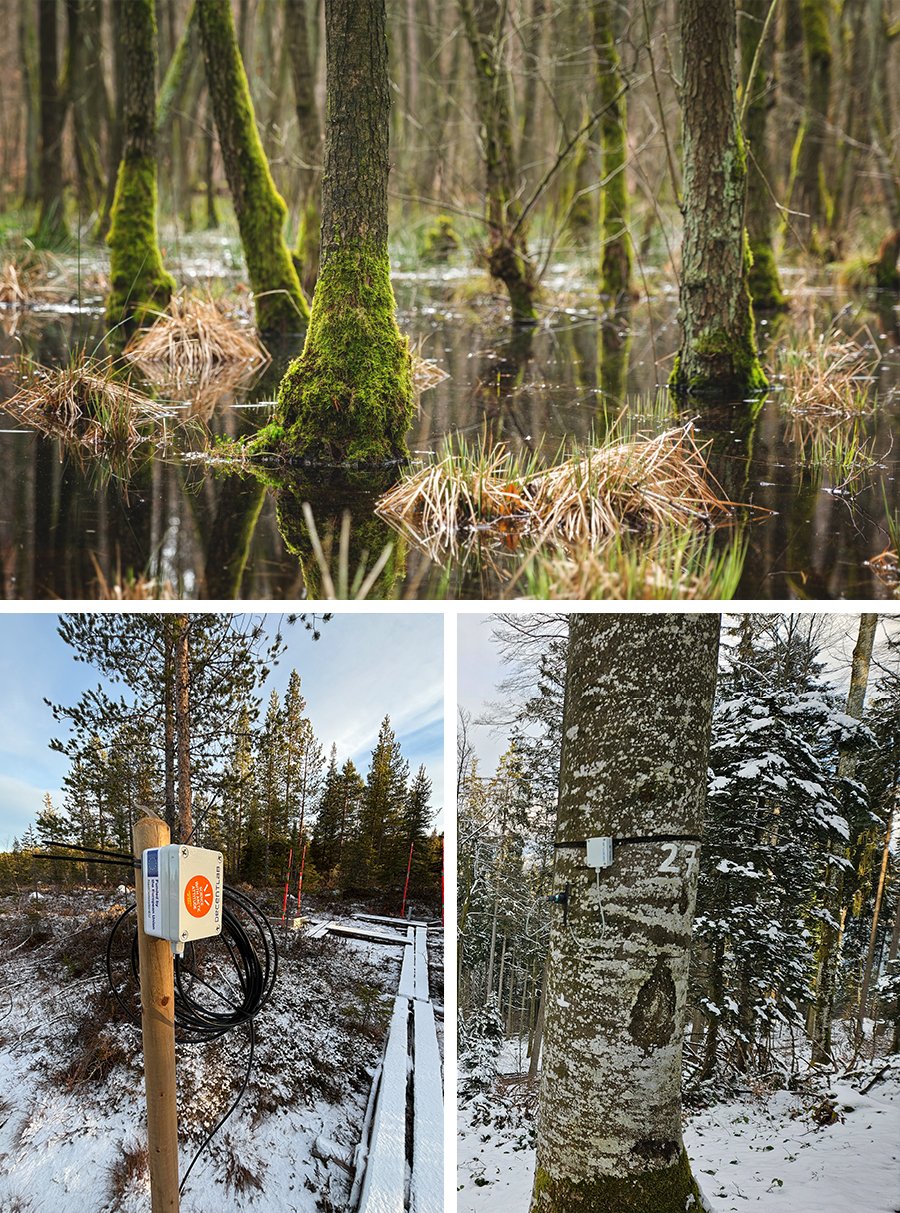
A Look at Practical Application: Earlier in 2025, we reported on the "Peatland Restoration Research in Finland" project, which utilizes Decentlab sensors, including the DL-PR26 and DL-ZN1. In this EU-funded project (LIFE PeatCarbon),researchers are investigating the effects of rewetting on the water cycle and greenhouse gas emissions to enable reliable, long-term projections for carbon storage.

Read the study